

Your data in Claude, ChatGPT, Copilot and any AI app you use: meet the AI connector and data dashboards
🚀 Our biggest release yet
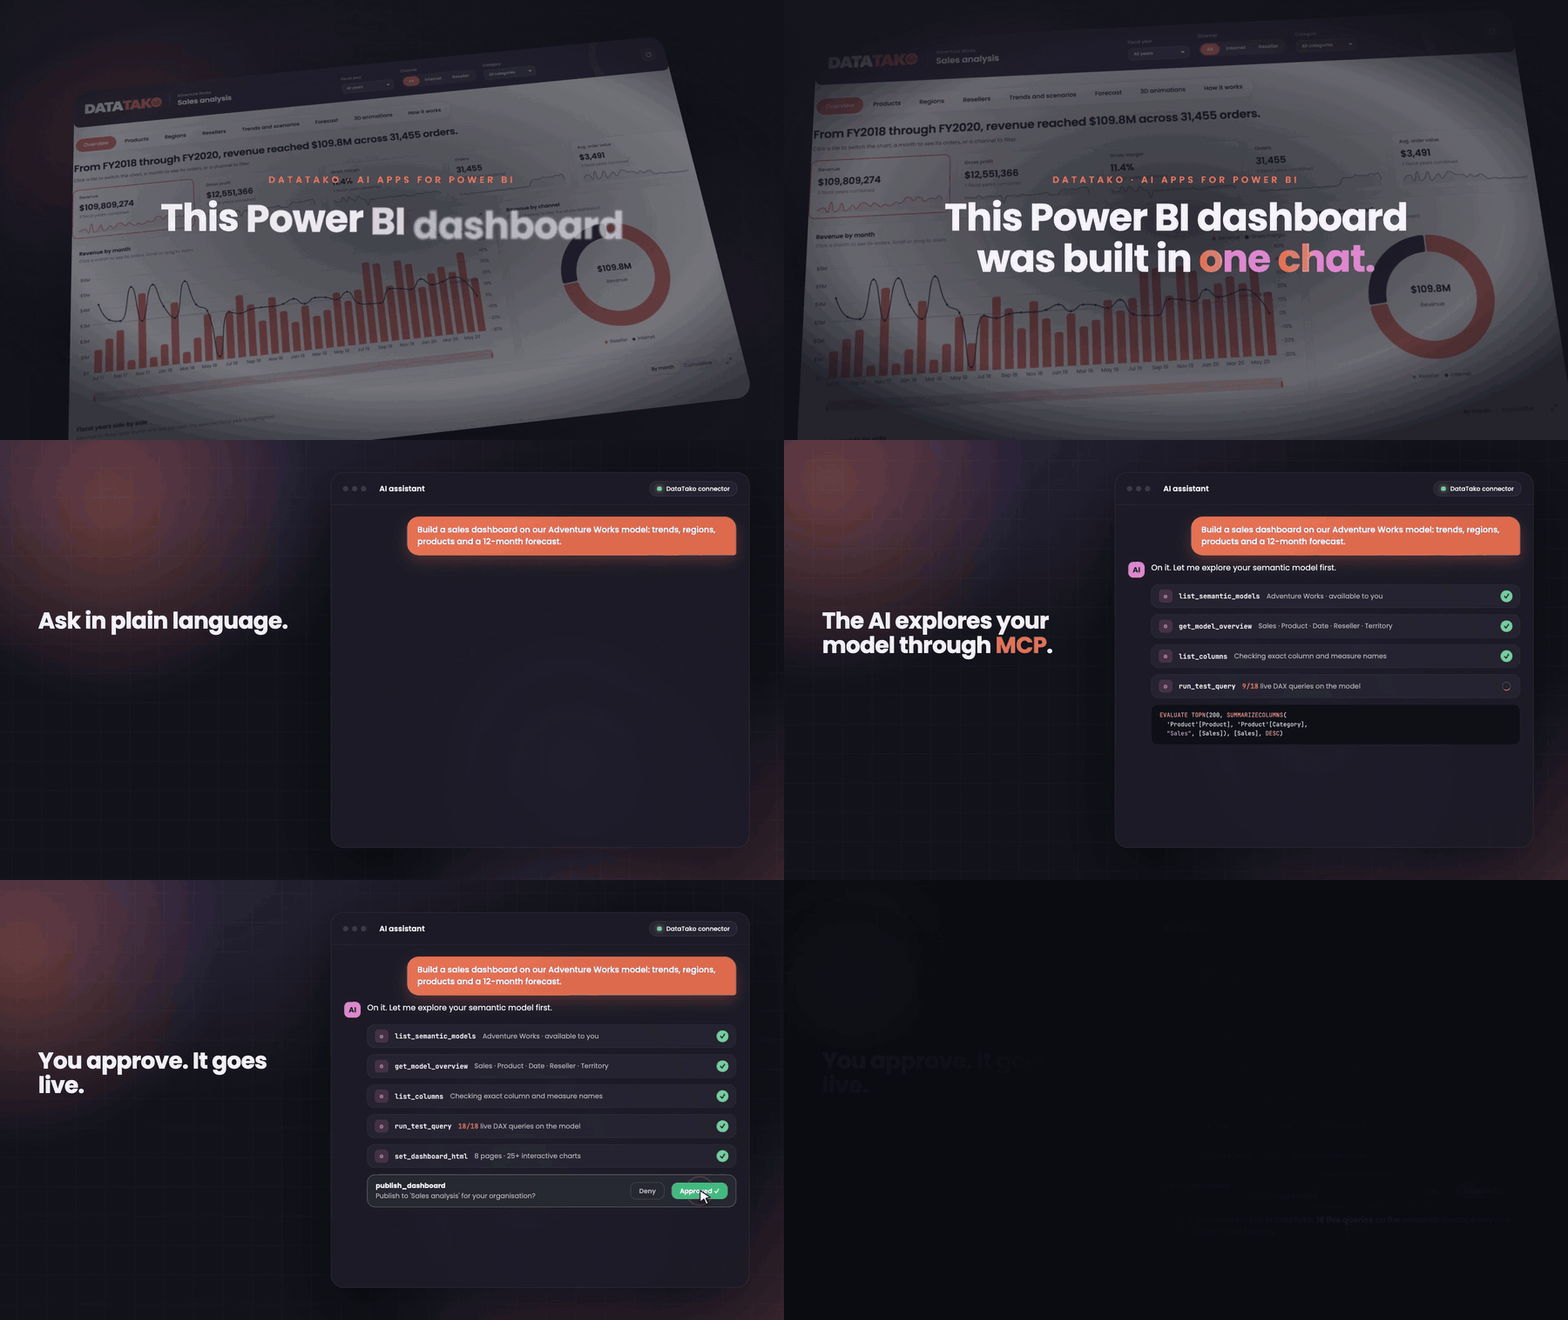
DataTako now connects to Claude, ChatGPT, Copilot and other MCP-compatible AI apps. Ask questions about your Power BI data straight from your AI app, and let it build fully interactive dashboards on your central semantic models. Every access control in DataTako applies, row-level security included.
Get started in 5 minutes
-
Switch it on (administrator). Go to Settings → Features and turn on AI connectors (MCP) and Data dashboards.
-
Choose what AI apps may use. Per report, assistant or management form. Nothing is exposed until you do.
-
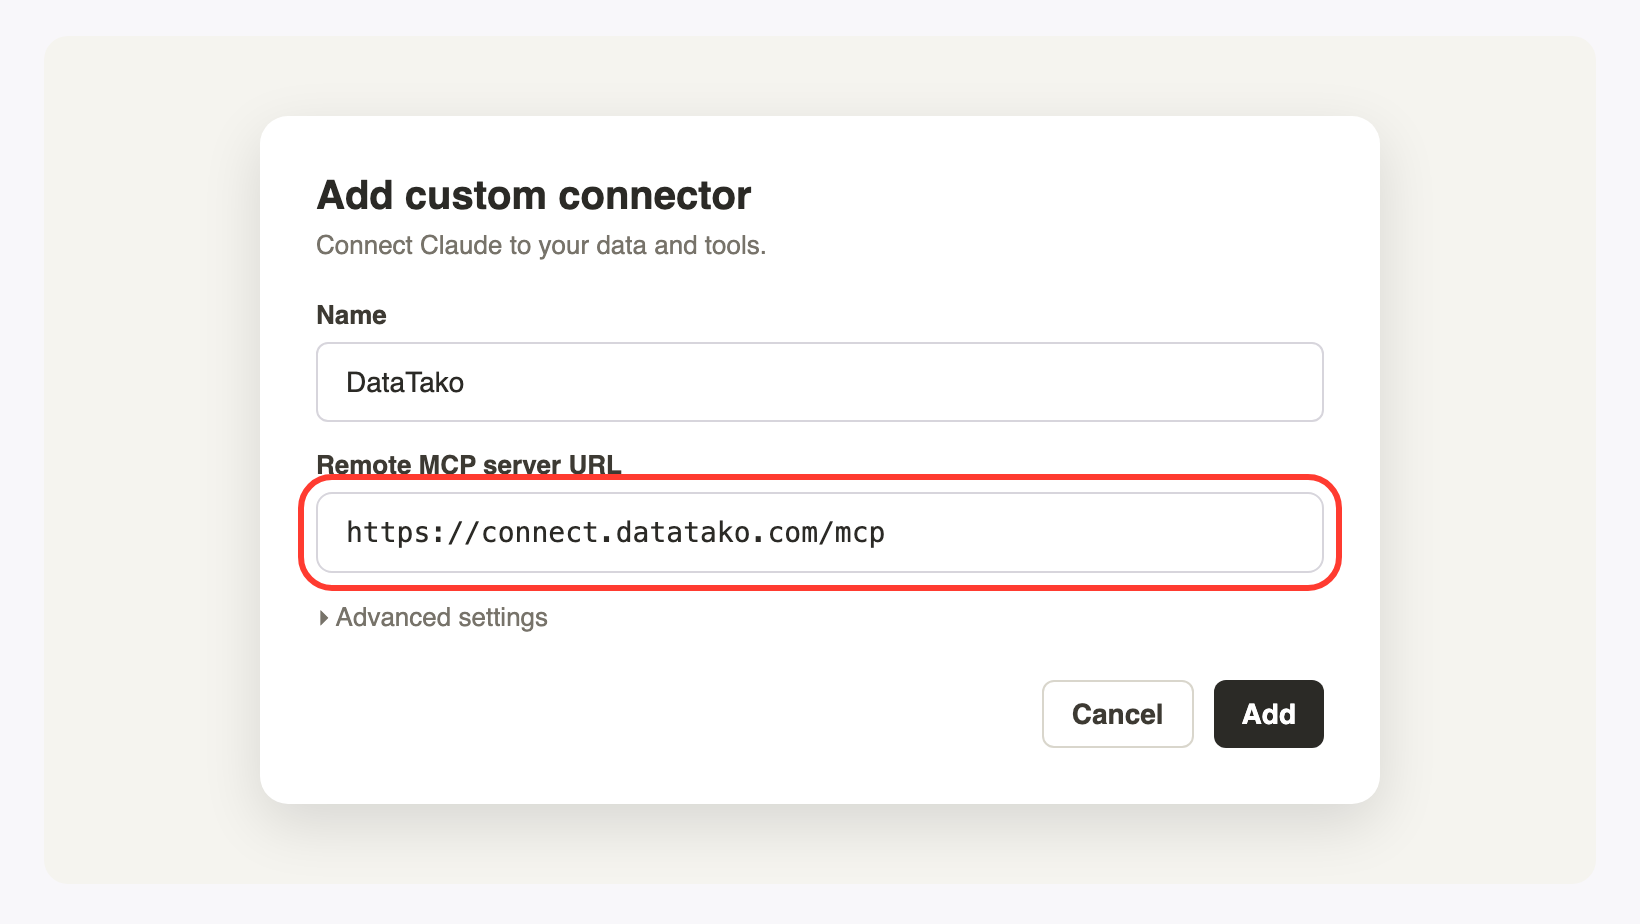
Connect your AI app. In Claude, ChatGPT or Copilot, add a custom connector with
https://connect.datatako.com/mcpand sign in with your normal DataTako account. -
Ask your first question. For example: "Which customers grew fastest this quarter?"
-
Build your first data dashboard. In Report configuration, click New → Data dashboard (built with AI) and paste the example prompt into your AI app.
👉 Start here: the step-by-step setup guide →
🤖 Talk to your data in your own AI app
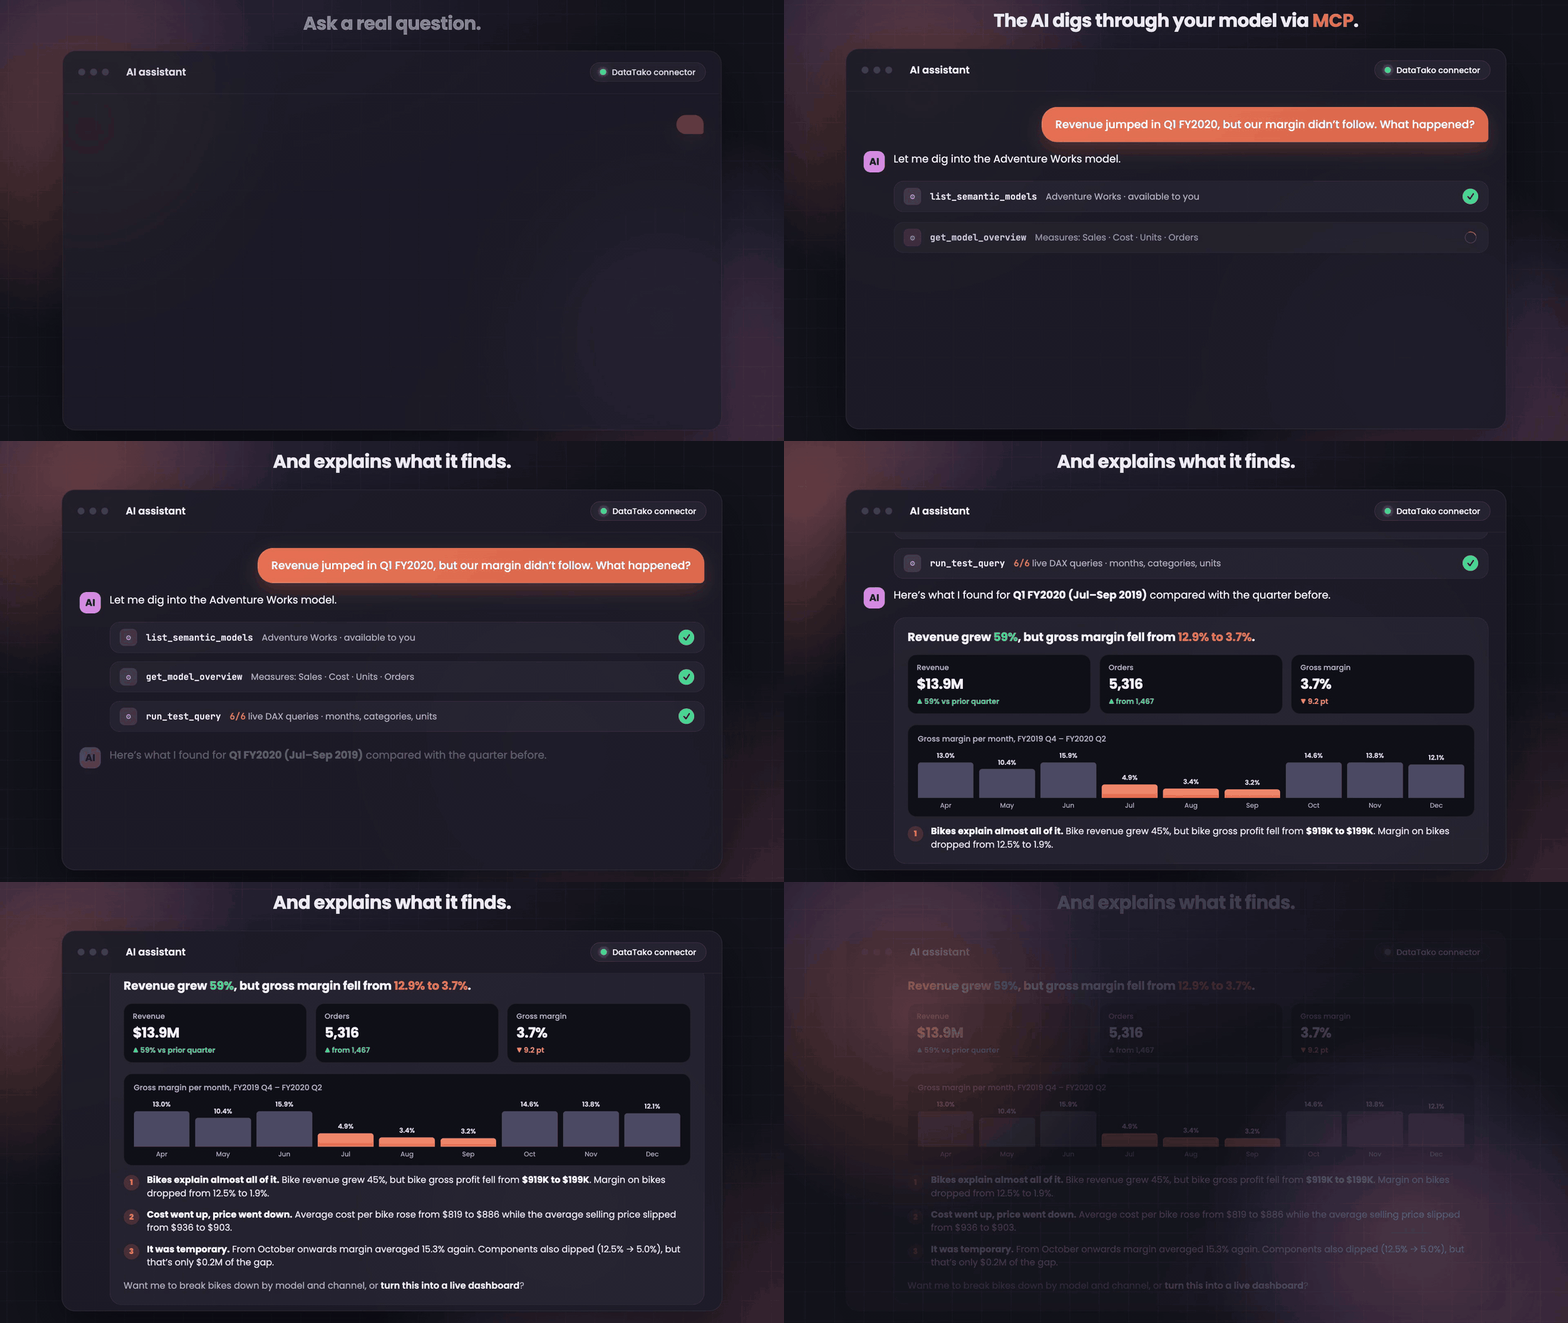
Once connected, your AI app queries the semantic models behind your reports and assistants live. It finds the right model, checks the exact measures and columns, and answers with your real numbers, so you can ask things like "Why did margin drop in March?"
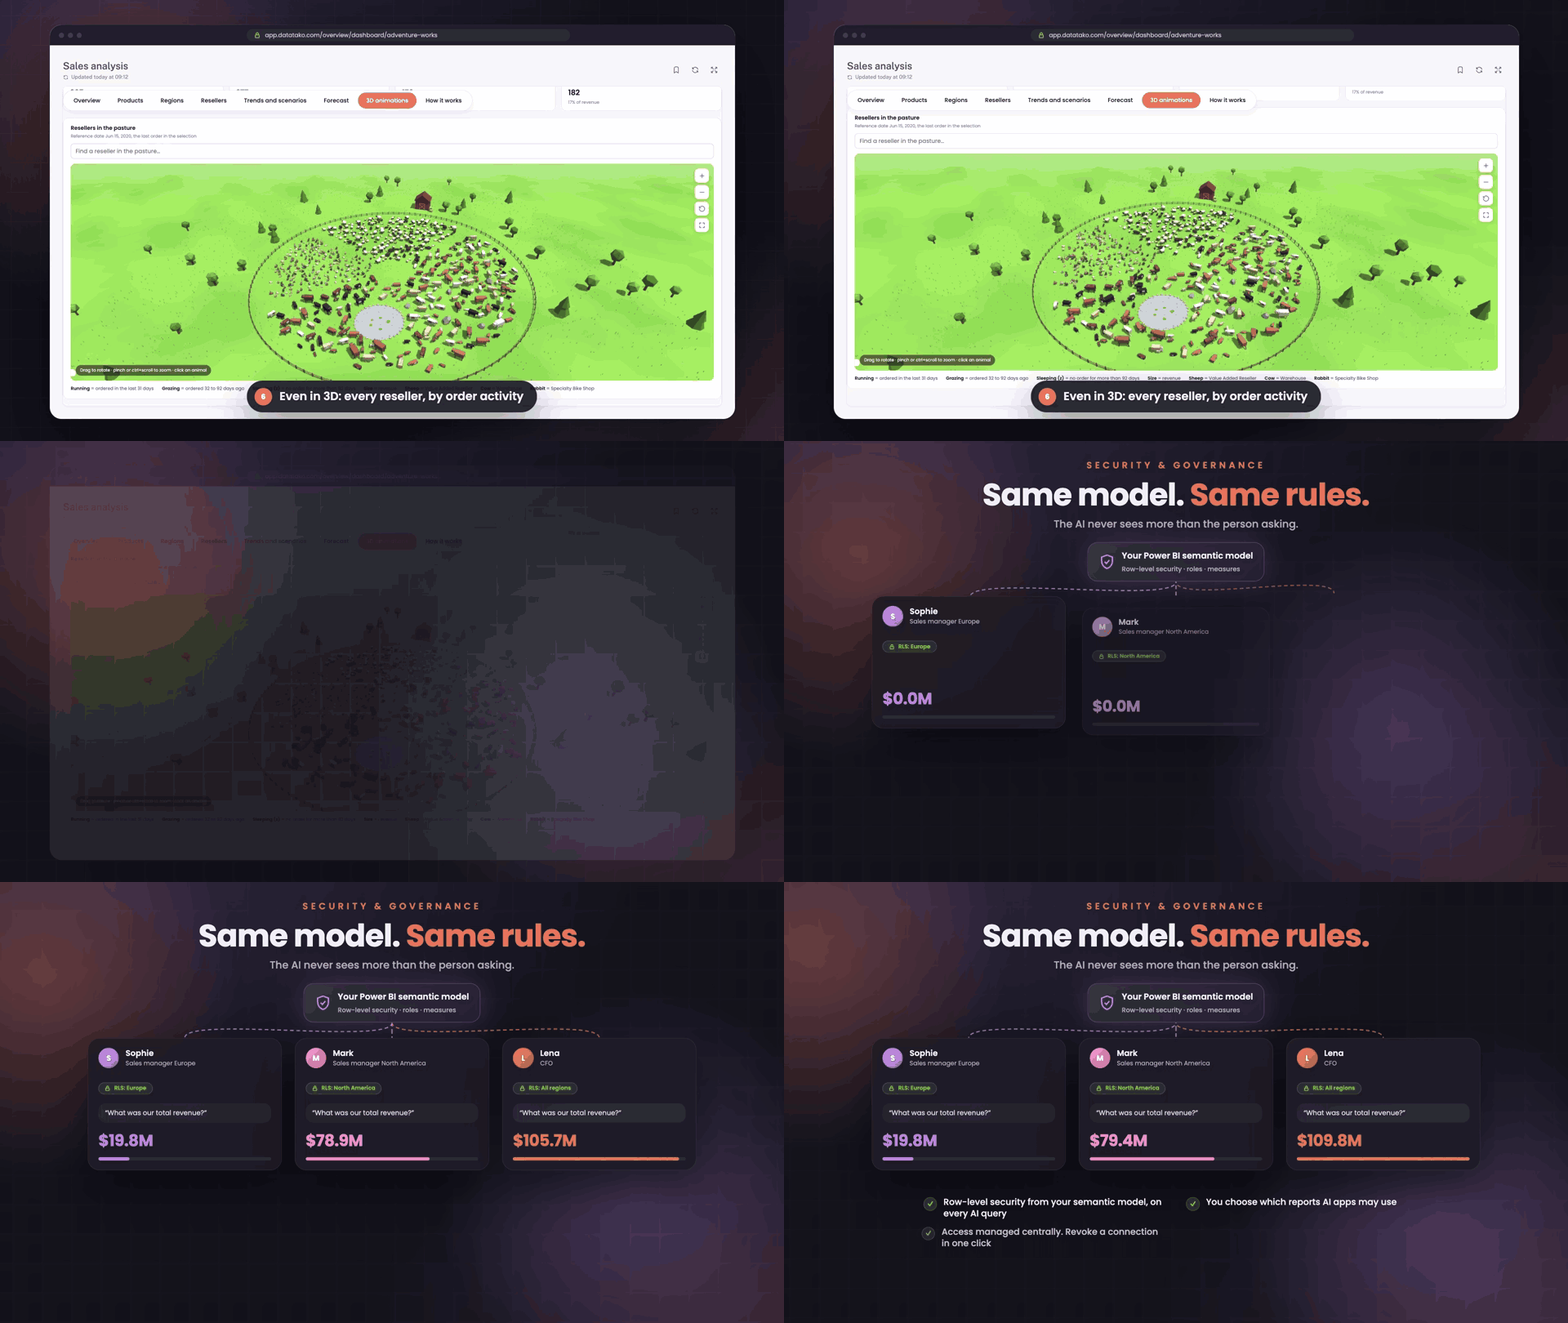
Same model, same rules
The AI app never sees more than the person asking. Ask three people for "total revenue" and each gets the number their row-level security allows.

-
Your security model, fully intact. The AI app sees exactly what the user sees in DataTako, row-level security included.
-
More than reading. AI apps can also work with your management forms: read, add, change or delete rows, for example budgets, targets or account manager lists. You decide per form what's allowed.
-
One connection, all your organisations. Users choose which of their organisations the AI app may use, and can change that at any time under Profile → AI apps.
-
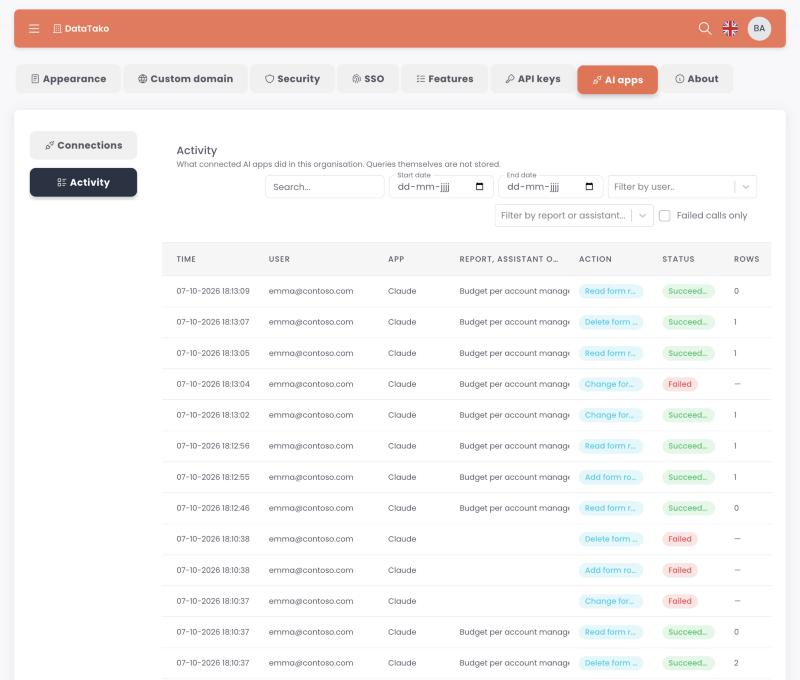
Full visibility. Under Settings → AI apps you see every connected app and every action it took: which report or form, whether it succeeded, which rows changed. You can disconnect an app with one click.
-
No AI credits needed. The language model runs in the user's own AI app subscription. No provider keys, no extra setup.
👉 Switch on AI connectors for your organisation → · Troubleshooting
📊 Data dashboards: built with AI, on your semantic models
Your central semantic models, now as fully interactive dashboards. Data dashboards run directly on the Power BI semantic models you already maintain: the same measures, the same definitions, one version of the truth. Your AI app builds them, you publish them in DataTako, and every access control applies automatically.
-
Anything a web page can do. KPI tiles, charts and tables, slicers and date pickers, click-to-filter, drill-down from year to day or from category to transaction, multiple pages, detail panels, all in your users' language and number formats.
-
What-if scenarios on live data. Add sliders for price, volume or cost and watch revenue, profit and margin recalculate instantly.
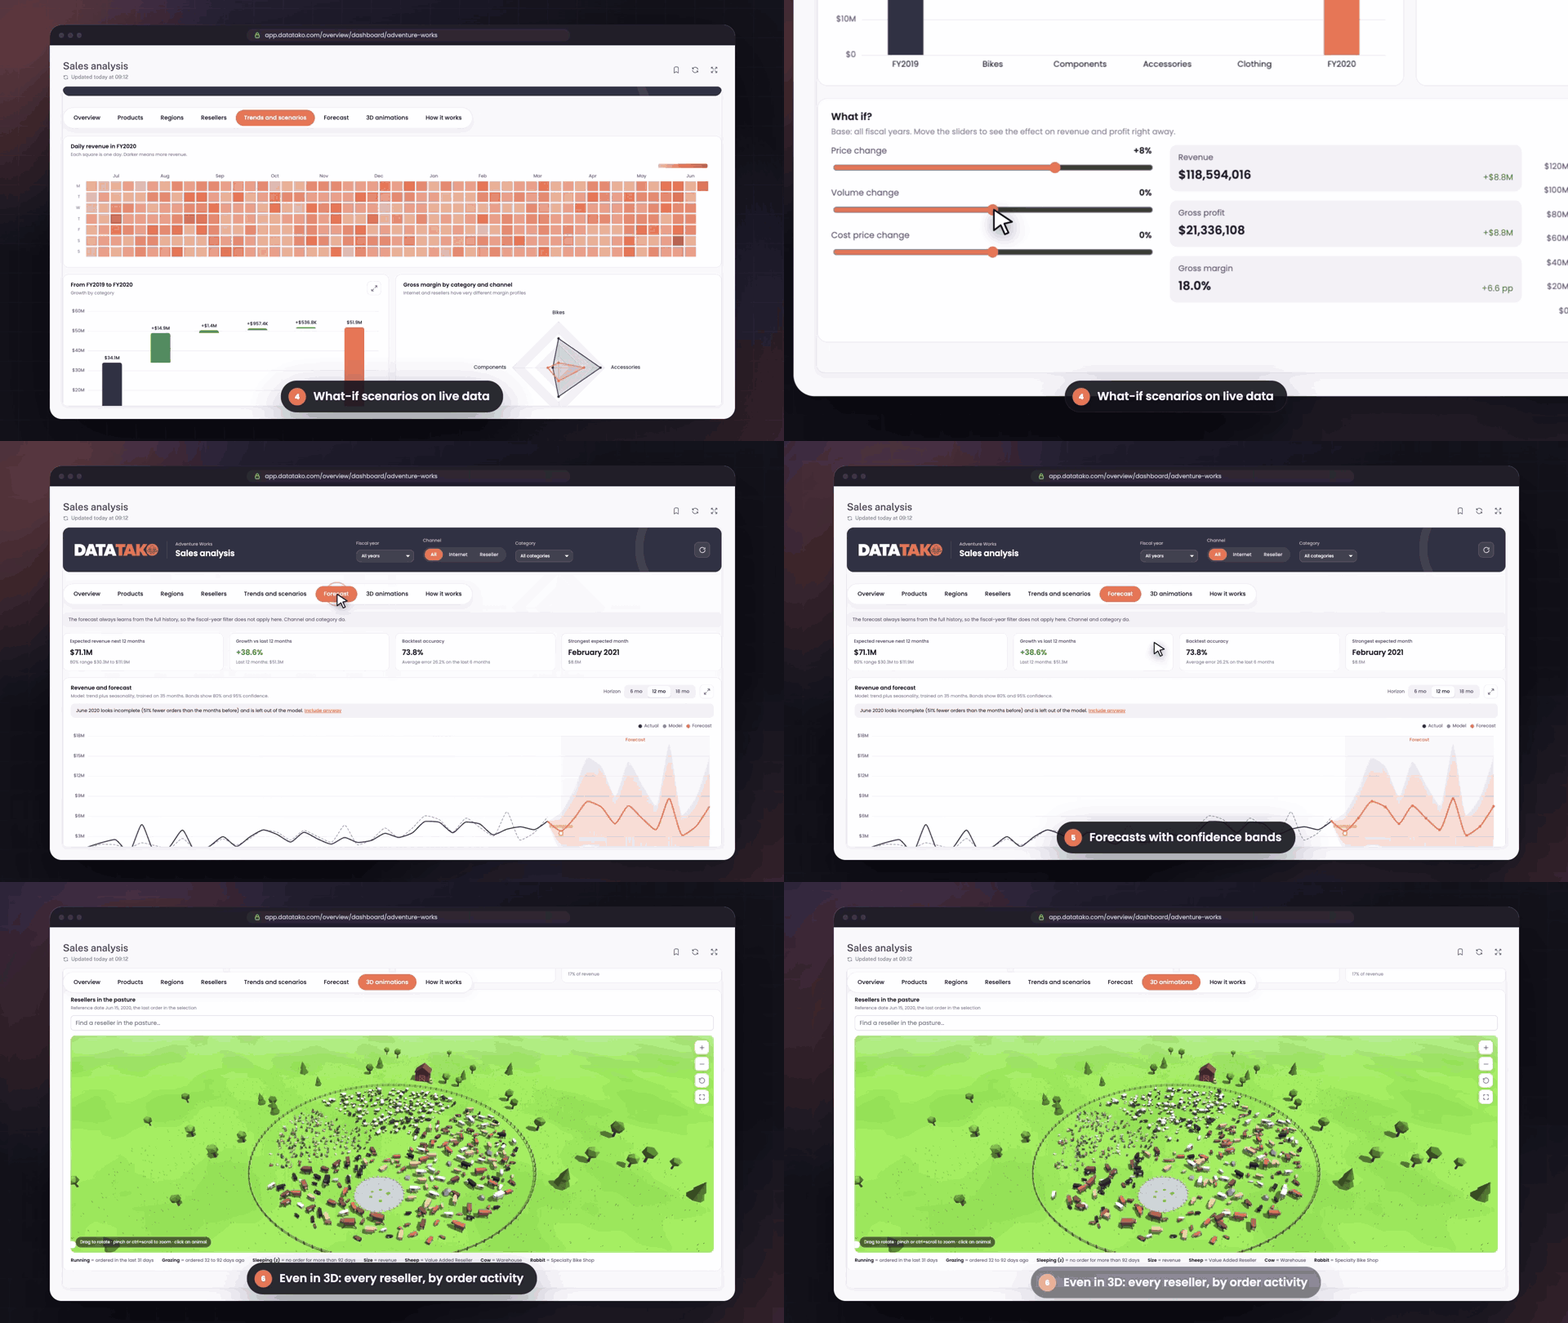
- Go beyond charts. Because a data dashboard is a web page, you can even visualise your data in 3D, like every reseller as an animal in a pasture that runs, grazes or rests depending on how recently it ordered.
Your first dashboard in three steps
-
Create it. In Report configuration, click New → Data dashboard (built with AI), pick the semantic model and who gets access.
-
Let your AI app build it. Copy the example prompt from the configuration page into your AI app and describe what you want to see. It saves its work as a draft.
-
Preview and publish. Check the draft in DataTako, preview it as specific row-level security roles, ask for changes in the same chat until it's right, then publish.
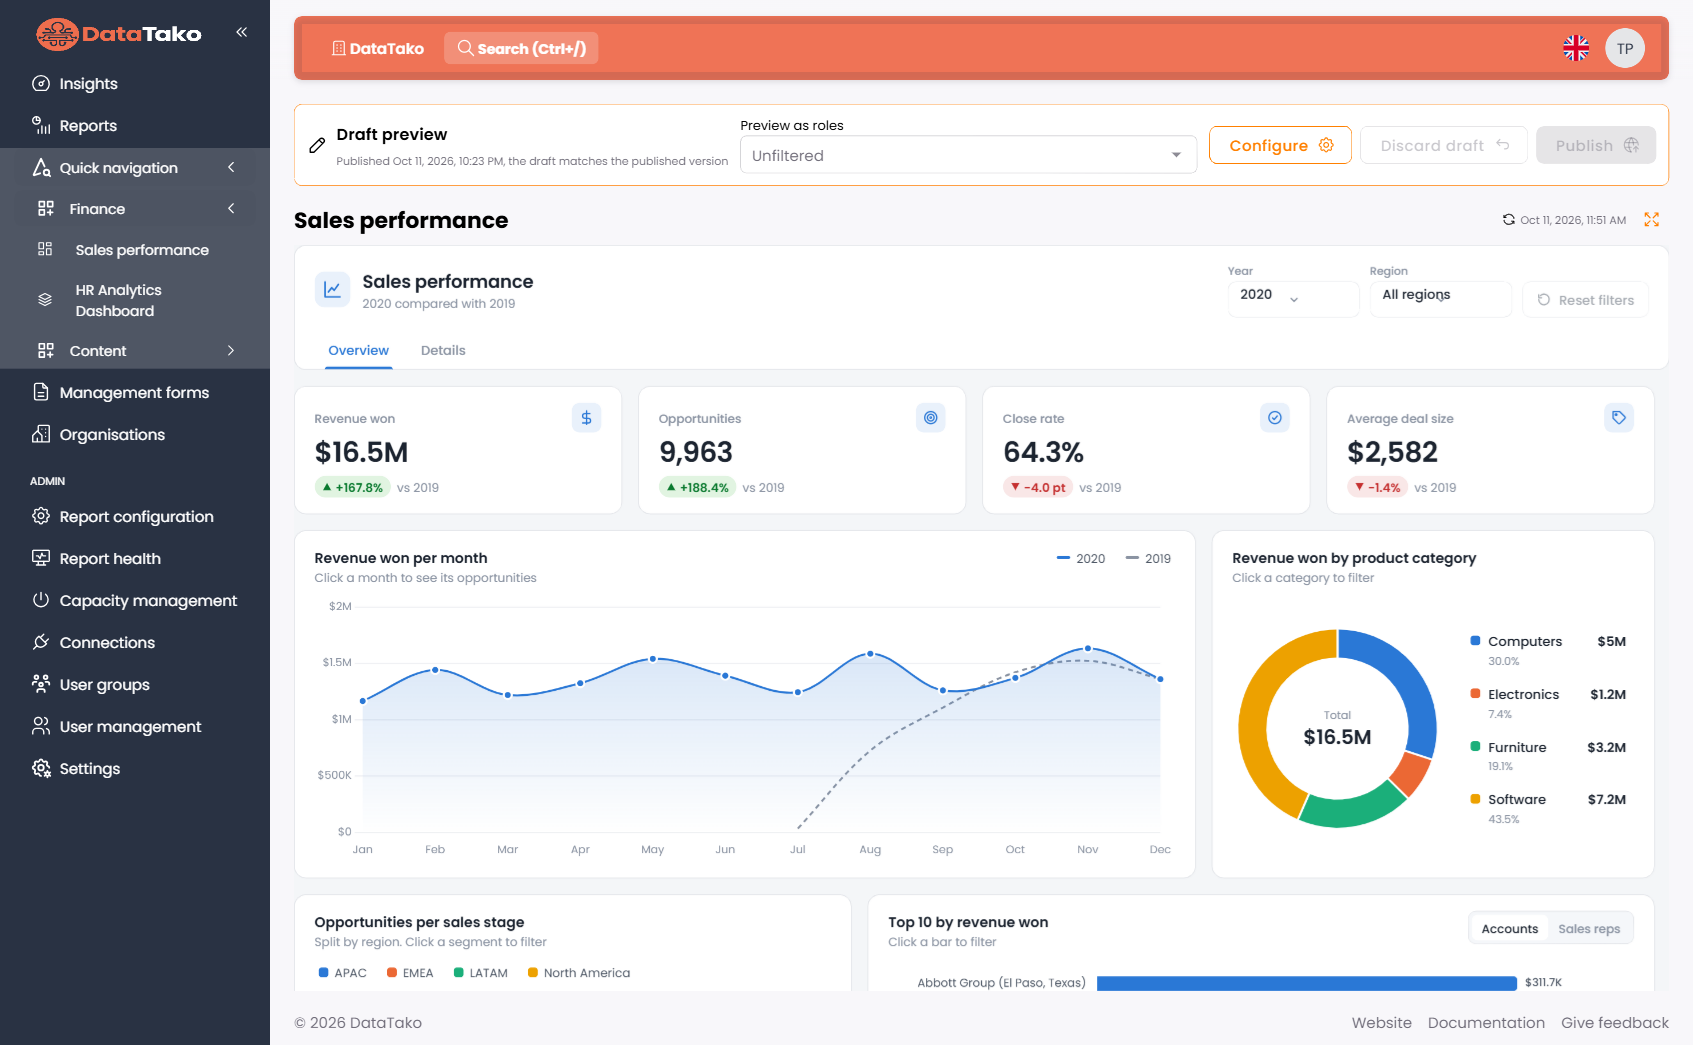
Data dashboards live in your report groups next to your reports, with the same sharing, user groups and row-level security roles. Every query runs live in Power BI with the viewer's own access.
👉 Build your first data dashboard → · Row-level security in DataTako
📧 Emails that look like you
-
Your brand in every email. Set your own header colour and logo for all DataTako emails, separate from the navigation bar. Invitations, subscriptions and everything else go out in your house style. Email settings
-
Customise your subscription emails. Set your own subject line and default texts for report subscriptions.
-
A personal message per subscription. Add extra text to an individual subscription, for example context for the recipients or a note on what changed. Read more about subscriptions
🔌 API
-
A bigger customer API. Work with suborganisations, report configurations, report groups and users straight from the API. DataTako API
-
Fetch more per call. The maximum page size for API requests has been increased.
-
See who can access what. New endpoints return the content and access of a user.
🎛️ Report management
-
Lock the report group and report order for viewers. Keep the structure exactly as you set it up with an organisation wide setting.
-
Cleaner report status overview. Deleted reports no longer show up.
🛠️ Fixes
-
Resetting an Office 365 mail connection now works.
-
Invitation emails always use the correct sender.
-
Sharing bookmarks works more reliably.
Ready to try it? 👉 Set up the AI connector → · Build a data dashboard →
📚 Find all guides at docs.datatako.com. Want help with your first AI connection or data dashboard? Just reach out, we'd love to show you.